Friday, June 5, 2009

Market wrap - 4:10PM

The final results for the day and end of week. Dow 8,763.09 +12.85 (0.15%) S&P 500 940.50 -1.96 (-0.21%) Nasdaq 1,849.42 -0.60 (-0.03%) Gold 963 -20 (-2.01%) Oil 68.49 -0.37 (-0.54%) Today by sector: Today's heatmap:
For the record, CNBC proclaimed today - the recession is over. Per Larry Kudlow. Larry, your still a shrill and painful to watch.

Employment report

Full report here Nonfarm payroll employment fell by 345,000 in May, about half the average monthly decline for the prior 6 months, the Bureau of Labor Statistics of the U.S. Department of Labor reported today. The unem- ployment rate continued to rise, increasing from 8.9 to 9.4 percent. Steep job losses continued in manufacturing, while declines moderated in construction and several service-providing industries. Unemployment (Household Survey Data) The number of unemployed persons increased by 787,000 to 14.5 million in May, and the unemployment rate rose to 9.4 percent. Since the start of the recession in December 2007, the number of unemployed persons has risen by 7.0 million, and the unemployment rate has grown by 4.5 percent- age points. (See table A-1.) Unemployment rates rose in May for adult men (9.8 percent), adult women (7.5 percent), whites (8.6 percent), and Hispanics (12.7 percent). The jobless rates for teenagers (22.7 percent) and blacks (14.9 percent) were little changed over the month. The unemployment rate for Asians was 6.7 percent in May, not seasonally adjusted, up from 3.8 percent a year earlier. (See tables A-1, A-2, and A-3.) Among the unemployed, the number of job losers and persons who completed temporary jobs rose by 732,000 in May to 9.5 million. This group has in- creased by 5.8 million since the start of the recession. (See table A-8.)

Pre-market - Friday, June 5, 2009

Pre-market futures up slightly: DJIA INDEX 8,771.00 41.00 S&P 500 945.50 5.00 NASDAQ 100 1,498.25 5.25 Gold 982 +17 1.73% Oil 69.19 +0.38 +0.55% Economic calendar today: Employment Situation 8:30 AM ET Consumer Credit 3:00 PM ET Earnings reports: AGYS Agilysys Inc. Technology AMWD American Woodmark Corp. Industrial Goods ODC Oil-Dri Corp. of America Basic Materials TOPS Top Ships Inc. Services XIDE Exide Technologies Industrial Goods
All eyes on the Employment numbers.

Thursday, June 4, 2009

Market wrap - 4:10PM

Dow 8,750.08 +74.80 (0.86%) S&P 500 942.41 +10.65 (1.14%) Nasdaq 1,850.02 +24.10 (1.32%) Gold 982 +17 1.73% Oil 68.82 +2.69 4.07% Today's gainers by sector: (wanna bet who leads this?) 
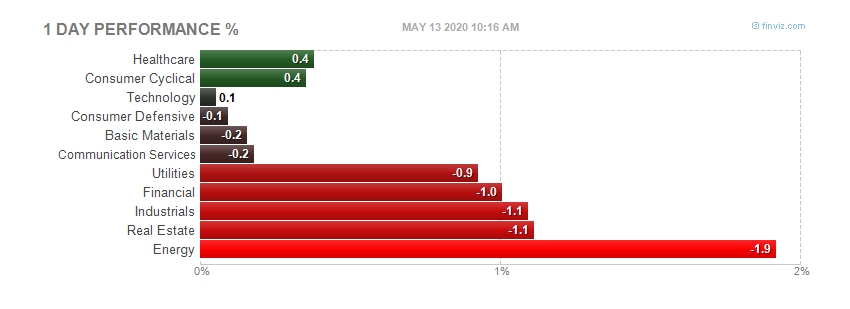
Financials! Imagine that! Today's heatmap:

BREAKING NEWS: SEC to Charge Former Countrywide CEO Angelo Mozilo with Insider Trading - 3:06PM

SEC to Charge Former Countrywide CEO Angelo Mozilo with Insider Trading. - CNBC The SEC will charge Angelo Mozilo, former chairman and CEO of Countrywide Financial, with insider trading, according to people familiar with the situation. The SEC will also charge the company's former chief operating officer, David Sambol, and former financial chief, Eric Sieracki, with securities fraud for failing to disclose the firm's relaxed lending standards in its 2006 annual report. The charges, which are expected to be announced by the SEC later today, will not be accompanied by any criminal indictments. Mozilo sold hundreds of millions in Countrywide stock in late 2006 and 2007 and is accused of remaining publicly upbeat about his company's prospects during a period when he knew things weren't going well for the firm. Countrywide became the nation's largest single home lender during the housing boom and was acquired by Bank of America after much of its business deteriorated.
Shocked, just shocked I tell you!

Art Cashin: Be Wary of Rally's New 52-Week Lows - Update 3:00

Art Cashin: Be Wary of Rally's New 52-Week Lows New U.S. jobless claims fell for a third straight week last week; productivity rose 1.6 percent. What does this herald for the stock markets? Art Cashin, UBS Financial Services director of floor operations, offered his Thursday insights to CNBC. Initial jobless claims "set the tone" for today's trading, Cashin said — and that tone "is rather neutral. No vim or vigor." "I'm surprised that the market behaved so benignly." But that tepid reaction is just one of the "emerging anomalies in market internals," he believes. "We had a terrific 3-day rally that took us up above the 200-day moving average. Yet the number of new lows increased. ...Mind you, these are 52-week lows." The seeming contradiction is "not overwhelming, but it is counterintuitive." Cashin touched on Pimco CEO Mohamed El-Erian's interview with the Financial Times, in which the latter commented on Ben Bernanke's statements this week. Cashin agreed with El-Erian's view that much of the positivity now is the result of inventory rebuilding. "That's not exactly green shoots," he said.

Jobless claims - 8:40AM &

Jobless claims - full report here. In the week ending May 30, the advance figure for seasonally adjusted initial claims was 621,000, a decrease of 4,000 from the previous week's revised figure of 625,000. The 4-week moving average was 631,250, an increase of 4,000 from the previous week's revised average of 627,250. The advance seasonally adjusted insured unemployment rate was 5.0 percent for the week ending May 23, unchanged from the prior week's revised rate of 5.0 percent. The advance number for seasonally adjusted insured unemployment during the week ending May 23 was 6,735,000, a decrease of 15,000 from the preceding week's revised level of 6,750,000. The 4-week moving average was 6,687,500, an increase of 88,750 from the preceding week's revised average of 6,598,750. The fiscal year-to-date average for seasonally adjusted insured unemployment for all programs is 5.184 million.
Productivity and costs - full report here. PRODUCTIVITY AND COSTS First Quarter 2009, Revised The Bureau of Labor Statistics of the U.S. Department of Labor today reported revised productivity data--as measured by output per hour of all persons--for the first quarter of 2009. The revised seasonally adjusted annual rates of productivity change in the first quarter were: 1.8 percent in the business sector and 1.6 percent in the nonfarm business sector. In both sectors, the first-quarter productivity gains were greater than the preliminary estimates reported on May 7, due solely to revisions to output growth. In manufacturing, the revised productivity changes in the first quarter were: -2.7 percent in manufacturing, -10.4 percent in durable goods manufacturing, and 1.9 percent in nondurable goods manufacturing. Manufacturing productivity in the first quarter of 2009 fell at a slower rate than was reported on May 7. Output and hours in manufacturing, which includes about 11 percent of U.S. business- sector employment, tend to vary more from quarter to quarter than data for the aggregate business and nonfarm business sectors. First-quarter measures are summarized in table A and appear in detail in tables 1 through 5.

Pre-market - Thursday - June 4, 2009

Futures up slightly today pre market. DJIA INDEX 8,703.00 34.00 S&P 500 935.90 4.20 NASDAQ 100 1,480.50 Gold 966 -19 -1.91% Oil 67.05 +0.93 +1.41% Economic calendar for today: Chain Store Sales Monster Employment Index BOE Announcement 7:00 AM ET ECB Announcement 7:45 AM ET Jobless Claims 8:30 AM ET Productivity and Costs 8:30 AM ET Ben Bernanke Speaks 8:45 AM ET Bank of Canada Announcement 9:00 AM ET 30-Yr Bond Announcement 9:00 AM ET EIA Natural Gas Report 10:30 AM ET 3-Month Bill Announcement 11:00 AM ET 6-Month Bill Announcement 11:00 AM ET 3-Yr Note Announcement 11:00 AM ET 10-Yr Note Announcement 11:00 AM ET Treasury STRIPS 3:00 PM ET Money Supply 4:30 PM ET Earnings reports today:
I found this little tidbit - Crude Oil Rises as Goldman Forecasts Rally to $85, Dollar Drops From the article: Oil gained after the New York-based bank raised its forecast to $85 a barrel from $65 for the end of the year and withdrew its prediction prices will dip prior to a rally. Yesterday, crude fell after a U.S. government report showed fuel demand fell the most since January last week, as rising prices and the recession hurt consumers. Now that's special, just special. Remember when crude was $140.00 a barrel, and gas was $4.00 at the pump? Who was pumping the price of crude then???? Now we have more oil than we can shake a stick at, and these swine bastards are doing it again. Yes, they are the same ones that did it before. Wonder how many ships they have sitting in the ocean waiting to drive the price up so they can make more money. Swine bastards!

Wednesday, June 3, 2009

Factory orders - 10:15AM

HIGHLIGHTS FROM THE PRELIMINARY REPORT ON MANUFACTURERS' SHIPMENTS, INVENTORIES, AND ORDERS New orders for manufactured goods in April, up two of the last three months, increased $2.5 billion or 0.7 percent to $344.4 billion, the U.S. Census Bureau reported today. This followed a 1.9 percent March decrease. Excluding transportation, new orders increased 0.1 percent. Shipments, down nine consecutive months, decreased $0.8 billion or 0.2 percent to $357.3 billion.This was the longest streak of consecutive monthly decreases since the series was first published on a NAICS basis in 1992 and followed a 1.8 percent March decrease. Unfilled orders, down seven consecutive months, decreased $8.9 billion or 1.2 percent to $748.7 billion. This was the longest streak of consecutive monthly decreases since November 2001-July 2002. This followed a 1.7 percent March decrease. The unfilled orders-to-shipments ratio was 6.01, up from 5.98 in March. Inventories, down eight consecutive months, decreased $5.1 billion or 1.0 percent to $517.6 billion. This was the longest streak of consecutive monthly decreases since March 2003-January 2004 and followed a 1.2 percent March decrease. The inventories-to-shipments ratio was 1.45, down from 1.46 in March. Full report here

ISM Non Manufacturing - 10:10AM

May 2009 Non-Manufacturing ISM Report On Business® NMI (Non-Manufacturing Index) at 44% DO NOT CONFUSE THIS NATIONAL REPORT with the various regional purchasing reports released across the country. The national report's information reflects the entire United States, while the regional reports contain primarily regional data from their local vicinities. Also, the information in the regional reports is not used in calculating the results of the national report. The information compiled in this report is for the month of May 2009. Business Activity Index at 42.4% New Orders Index at 44.4% Employment Index at 39% (Tempe, Arizona) — Economic activity in the non-manufacturing sector contracted in May, say the nation's purchasing and supply executives in the latest Non-Manufacturing ISM Report On Business®. The report was issued today by Anthony Nieves, C.P.M., CFPM, chair of the Institute for Supply Management™ Non-Manufacturing Business Survey Committee; and senior vice president — supply management for Hilton Hotels Corporation. "The NMI (Non-Manufacturing Index) registered 44 percent in May, 0.3 percentage point higher than the 43.7 percent registered in April, indicating contraction in the non-manufacturing sector for the eighth consecutive month, but at a slightly slower rate. The Non-Manufacturing Business Activity Index decreased 2.8 percentage points to 42.4 percent. The New Orders Index decreased 2.6 percentage points to 44.4 percent, and the Employment Index increased 2 percentage points to 39 percent. The Prices Index increased 6.9 percentage points to 46.9 percent in May, indicating a slower decrease in prices from April. According to the NMI, six non-manufacturing industries reported growth in May. Respondents' comments remain mixed and vary by industry and company. Some respondents indicate that there are signs of stabilization, while others continue to have a negative outlook on the economy." Full report here

ADP report - 8:30AM

Wednesday, June 3, 2009, 8:15 A.M. ET Nonfarm private employment decreased 532,000 from April to May 2009 on a seasonally adjusted basis, according to the ADP National Employment Report®. The estimated change of employment from March to April was revised by 54,000, from a decline of 491,000 to a decline of 545,000. Monthly employment losses in April and May averaged 539,000. This is a notable improvement over the first three months of the year, when monthly losses averaged 691,000. Nevertheless, despite some recent indications that economic activity is stabilizing, employment, which usually trails overall economic activity, is likely to decline for at least several more months, although perhaps not as rapidly as during the last six months. May’s ADP Report estimates nonfarm private employment in the service-providing sector fell by 265,000. Employment in the goods-producing sector declined 267,000, with employment in the manufacturing sector dropping 149,000, its thirty-ninth consecutive monthly decline. Large businesses, defined as those with 500 or more workers, saw employment decline by 100,000, while medium-size businesses with between 50 and 499 workers declined 223,000. Employment among small-size businesses, defined as those with fewer than 50 workers, declined 209,000. Since reaching peak employment in January 2008, small-size businesses have shed 2,125,000 jobs. In May, construction employment dropped 108,000. This was its twenty-eighth consecutive monthly decline, and brings the total decline in construction jobs since the peak in January 2007 to 1,345,000. Employment in the financial services sector dropped 32,000, the eighteenth consecutive monthly decline. Full report here.

Pre-market - Wednesday, June 3, 2009 - 8:30AM - a tad late

Futures down a little (this is after the ADP report) DJIA INDEX 8,688.00 -26.00 S&P 500 938.70 -3.90 NASDAQ 100 1,475.00 -3.50 Economic calendar for today: MBA Purchase Applications 7:00 AM ET Challenger Job-Cut Report 7:30 AM ET ADP Employment Report 8:15 AM ET Ben Bernanke Speaks 10:00 AM ET Factory Orders 10:00 AM ET ISM Non-Mfg Index 10:00 AM ET EIA Petroleum Status Report 10:30 AM ET Earning reports today:

Tuesday, June 2, 2009

Market wrap - 4:10PM

Dow 8,741.41 +19.97 (0.23%) S&P 500 944.66 +1.79 (0.19%) Nasdaq 1,836.80 +8.12 (0.44%) Gold 984 +4 +0.45% Oil 68.71 -0.03 -0.04% Today by sector: Today's heatmap:
Not much market today. Mostly sideways with no sector standing out. Volume a little on the light side. Tomorrows economic numbers: MBA Purchase Applications 7:00 AM ET Challenger Job-Cut Report 7:30 AM ET ADP Employment Report 8:15 AM ET Ben Bernanke Speaks 10:00 AM ET Factory Orders 10:00 AM ET ISM Non-Mfg Index 10:00 AM ET EIA Petroleum Status Report 10:30 AM ET The ADP employment is a peek to see what will come out Friday for jobs numbers. Bernanke can move the market, and the Factory Orders and ISM non-mfg reports will be spun into green shoots or flowers by the CNBC cheerleaders. The Petroleum report will tell us oil goes higher. Doesn't matter what the numbers say. Oil will go up until it hits at least 75 dollars or higher, or we get our pitchforks out.

Home sales - 10:05AM

Full report here. Pending Home Sales Up for Three Months in a Row WASHINGTON, June 02, 2009 Record low mortgage interest rates boosted pending home sales for the third consecutive month, with some benefit now from the first-time buyer tax credit, according to the National Association of Realtors®. The Pending Home Sales Index,1 a forward-looking indicator based on contracts signed in April, rose 6.7 percent to 90.3 from a reading of 84.6 in March, and is 3.2 percent above April 2008 when it was 87.5. Lawrence Yun, NAR chief economist, said buyers are responding to very favorable market conditions. “Housing affordability conditions have been at historic highs, but now the $8,000 first-time buyer tax credit is beginning to impact the market,” he said. “Since first-time buyers must finalize their purchase by November 30 to get the credit, we expect greater activity in the months ahead, and that should spark more sales by repeat buyers.” The Pending Home Sales Index in the Northeast shot up 32.6 percent to 78.9 in April and is 0.8 percent above a year ago. In the Midwest the index rose 9.8 percent to 90.4 and is 11.1 percent above April 2008. The index in the South slipped 0.2 percent to 93.0 in April but is 3.5 percent higher than a year ago. In the West the index rose 1.8 percent to 94.8 but is 2.9 percent below April 2008.

Pre-market - Tuesday, June 2, 2009

Futures are flat at 8:00AM Economic reports today: Motor Vehicle Sales ICSC-Goldman Store Sales - 7:45 AM ET Redbook - 8:55 AM ET Pending Home Sales Index - 10:00 AM ET 4-Week Bill Auction - 1:00 PM ET 52-Week Bill Auction - 1:00 PM ET Earnings reports today: Today's headlines: Goldman Sachs Raises $1.91 Billion in ICBC Stock Sale (Update1) - Bloomberg JPMorgan, American Express Will Tap Stock Markets to Repay TARP - Boomberg

Monday, June 1, 2009

Market wrap - 4:15PM

Wow!
Dow 8,721.36 +221.03 (2.60%)
S&P 500 942.87 +23.73 (2.58%)
Nasdaq 1,828.68 +54.35 (3.06%)
Gold 980 -0 -0.03%
Oil 68.33 +2.27 3.43% Today's action by sector: Today's heatmap:
What can you say? A couple of "decent" economic reports, another month of uptick from China. GM goes bankrupt. This all equals a 220 point rally in the DOW. Ok.

Even more Sillyness - SPX from Friday to today - 12:20PM

Well lookie here: Looking at this chart, Friday, the SPX was around 910 2:15PM on Friday. It began to drop, going down to 905 around 2:53PM. The low was 887 Friday morning at 10:10. From 2:53 (or we can just round it to 3:00PM)it rockets to close at 919 with a huge spike in the last 5 minutes. Today, Monday, the SPX gaps up to open significantly higher at 923. The market proceed to charge higher (on the GM news as one thing) to 942 by 10:20AM. Let's do a little math here. From 905 to 942 is 37 points. The climb took all of 2 hours between Friday afternoon and 10:20 this morning. A couple of observations. 1)The economic data that came out last week was not all that good, and even bad in some cases. 2)The ISM and spending data that came out today was not awful, but not that good either. 3)GM, once the largest company in the world, has filed for bankruptcy. 4)We knew this was coming, probably on Monday, and considering the climb in the SPX last week, it would make a good case to be short for the weekend, no? Looking at the huge spike in the last 5 minutes Friday, did someone NOT want to be short for Monday open? Did someone know something we, the average investor did not? Seems awful funny to me, or is this just plain Sillyness? Anyone wonder why we call this site Sillymeter?

GM - more Sillyness - That's where the name comes from - Update - 12:12PM

In case you were living in a cave, General Motors (GM) filed for bankruptcy today. And their stock is going up - it is worth NOTHING. Yep, day traders, but still.

ISM numbers & Construction spending - 10:15AM

ISM Manufacturing Index - 42.8
Construction Spending - March APRIL 2009 CONSTRUCTION AT $968.7 BILLION ANNUAL RATE The U.S. Census Bureau of the Department of Commerce announced today that construction spending during April 2009 was estimated at a seasonally adjusted annual rate of $968.7 billion, 0.8 percent (±1.3%)* above the revised March estimate of $961.3 billion. The April figure is 10.7 percent (±1.8%) below the April 2008 estimate of $1,085.2 billion. During the first 4 months of this year, construction spending amounted to $286.3 billion, 11.3 percent (±1.4%) below the $322.8 billion for the same period in 2008. Full report here.

Changes to the DOW 30 - GM, Citi out - 9:20AM

Dow 30 components GM and Citi (GM & C)out, replaced by Cisco & Travelers (CSCO & TRV).

Pre-market - Monday, June 1, 2009

Futures up large today, before consumer spending: DJIA INDEX 8,610.00 122.00 S&P 500 933.80 15.70 NASDAQ 100 1,453.00 17.50 Gold - 980 +17 1.78% Oil - 67.82 +1.51 +2.28% Personal Income and Outlays - 8:30 AM ET ISM Mfg Index - 10:00 AM ET Construction Spending - 10:00 AM ET 4-Week Bill Announcement - 11:00 AM ET 3-Month Bill Auction - 1:00 PM ET 6-Month Bill Auction - 1:00 PM ET GM files for bankruptcy. Earnings reports today: