Can AIG be far behind?

 The important thing to notice is the neckline, at the 878.94 level, established by the candle (low wick)on 5/15/09. This level is just a tad below the other neckline candle on 7/7/09. This low is a little higher at 879.93. This pattern is known as a reversal pattern. Since the March 6th low, or the March 9th closing low, the market has been on an uptrend, so a reversal would be signifying the market is turning and heading lower.
Much to the chagrin of the Government, who would like us to think everything is getting better, and the All Star cheerleaders on CNBC, who's on a mission to pump it higher for their parent company GE (and their buddies on Wall Street, especially the banks) this line represents the confirmation of the reversal. In other words, once this line is breached, and closes below this level, the Bears will come out of hibernation and short the market.
You can see the battle of the Bulls & Bears and how this line has been successfully defended (so far) by the Bulls with this chart. The numbers above the candles designate the closing:
The important thing to notice is the neckline, at the 878.94 level, established by the candle (low wick)on 5/15/09. This level is just a tad below the other neckline candle on 7/7/09. This low is a little higher at 879.93. This pattern is known as a reversal pattern. Since the March 6th low, or the March 9th closing low, the market has been on an uptrend, so a reversal would be signifying the market is turning and heading lower.
Much to the chagrin of the Government, who would like us to think everything is getting better, and the All Star cheerleaders on CNBC, who's on a mission to pump it higher for their parent company GE (and their buddies on Wall Street, especially the banks) this line represents the confirmation of the reversal. In other words, once this line is breached, and closes below this level, the Bears will come out of hibernation and short the market.
You can see the battle of the Bulls & Bears and how this line has been successfully defended (so far) by the Bulls with this chart. The numbers above the candles designate the closing:
 In the last three days, notice how small the trading range has been? Also, the intraday range has broken this line, but the Bulls have successfully pushed it back above. This pattern was the hot topic on CNBC this week, or at least the last three days. It has been talked about on many blogs and trading sights as well. As usual, CNBC is a day late. But they did their homework, and went back far enough on a chart to call this "a possible" inverse head and shoulders, which means a reversal to the upside. Good grief!
Friday, they were talking to Steve "this market is going higher" Grasso about where the market is going. This was some time in the early afternoon. His answer was "if it closes above 880, this market is going higher next week." Really? Of course it might, and I assume he was talking about the neckline at 878.94, but I won't get too technical on him. As you can see by the chart above, this line has been quite the battle for the last three days. But as Bob Pisoni would say "the important thing is" the line was defended and the market is set to the upside.
Earnings season is upon us, with Alcoa the first DOW component to report this last week. Some of the large banks are due to report next week, including Goldman Sachs on Tuesday, followed by JP Morgan on Thursday. Friday is littered with Citigroup, Bank of America and GE, who trades like a bank. None of these companies are in very good shape, if you go by their recent stock performance (the ones that report on Friday).
In the grand plan of bullshitting the people, this market needs to be pumped up. With earnings expectations lowered to a level easy enough for a cave man to make them, I expect some companies (especially a bank or two, most likely GS) to report the "better than expected" earnings next week.
As long as this neckline is defended by the Bulls, the better than expected earnings by the banks will drive this market higher, along with the slobbering CNBC cheerleaders. We will hear "Green Shoots" galore and "the big money is getting off the sidelines, it's time to "buy, buy, buy" will be heard all day. Utopia has arrived in the stock market world. Dennis Kneale who declared the recession over last week (and got into it with the blogesphere for being the idiot that he is)will likely have wet pants while telling us "I told you so."
For this to happen, they needed to defend the neckline. Friday morning Goldman upgraded about every stock in the tech world, after someone upgraded the home builders on Thursday. Home builders? Give me a break. But if you look at the stocks on Thursday, the home builders, casinos and hotels all did very will, helping to drive the market higher. Along with a bunch of other obscure bullshit stocks that nobody has ever heard of. On Friday, along with the Goldman upgrades and a mid to late day surge, with a nice ramp at the end of the day they made their bogey, closing .19 above the neck. Well done! But really, who thinks home builders, casinos and hotels are a good buy?
But I digress. Here is the intraday from Friday's action on the S&P500.
In the last three days, notice how small the trading range has been? Also, the intraday range has broken this line, but the Bulls have successfully pushed it back above. This pattern was the hot topic on CNBC this week, or at least the last three days. It has been talked about on many blogs and trading sights as well. As usual, CNBC is a day late. But they did their homework, and went back far enough on a chart to call this "a possible" inverse head and shoulders, which means a reversal to the upside. Good grief!
Friday, they were talking to Steve "this market is going higher" Grasso about where the market is going. This was some time in the early afternoon. His answer was "if it closes above 880, this market is going higher next week." Really? Of course it might, and I assume he was talking about the neckline at 878.94, but I won't get too technical on him. As you can see by the chart above, this line has been quite the battle for the last three days. But as Bob Pisoni would say "the important thing is" the line was defended and the market is set to the upside.
Earnings season is upon us, with Alcoa the first DOW component to report this last week. Some of the large banks are due to report next week, including Goldman Sachs on Tuesday, followed by JP Morgan on Thursday. Friday is littered with Citigroup, Bank of America and GE, who trades like a bank. None of these companies are in very good shape, if you go by their recent stock performance (the ones that report on Friday).
In the grand plan of bullshitting the people, this market needs to be pumped up. With earnings expectations lowered to a level easy enough for a cave man to make them, I expect some companies (especially a bank or two, most likely GS) to report the "better than expected" earnings next week.
As long as this neckline is defended by the Bulls, the better than expected earnings by the banks will drive this market higher, along with the slobbering CNBC cheerleaders. We will hear "Green Shoots" galore and "the big money is getting off the sidelines, it's time to "buy, buy, buy" will be heard all day. Utopia has arrived in the stock market world. Dennis Kneale who declared the recession over last week (and got into it with the blogesphere for being the idiot that he is)will likely have wet pants while telling us "I told you so."
For this to happen, they needed to defend the neckline. Friday morning Goldman upgraded about every stock in the tech world, after someone upgraded the home builders on Thursday. Home builders? Give me a break. But if you look at the stocks on Thursday, the home builders, casinos and hotels all did very will, helping to drive the market higher. Along with a bunch of other obscure bullshit stocks that nobody has ever heard of. On Friday, along with the Goldman upgrades and a mid to late day surge, with a nice ramp at the end of the day they made their bogey, closing .19 above the neck. Well done! But really, who thinks home builders, casinos and hotels are a good buy?
But I digress. Here is the intraday from Friday's action on the S&P500.
 We all know the housing mess is far from over, and the 800 pound gorilla in the room is Commercial Real Estate, both which can be bought with the ETF known as IYR. Take a look at the intraday chart of IYR on Friday:
 Quite the battle at the end of the day is it not? Let me ask, who in their right mind would buy that much IYR after 3:30 on Friday going into a weekend? Actually, who would buy that crap to begin with? Seems either fishy or just plain dumb to me. There is plenty of pain to come in the world of real estate.
I will be watching this neckline very close (as I have been) and depending on what happens next week, will determine if I go long or short. The neckline is key.
Happy Trading
Quite the battle at the end of the day is it not? Let me ask, who in their right mind would buy that much IYR after 3:30 on Friday going into a weekend? Actually, who would buy that crap to begin with? Seems either fishy or just plain dumb to me. There is plenty of pain to come in the world of real estate.
I will be watching this neckline very close (as I have been) and depending on what happens next week, will determine if I go long or short. The neckline is key.
Happy Trading
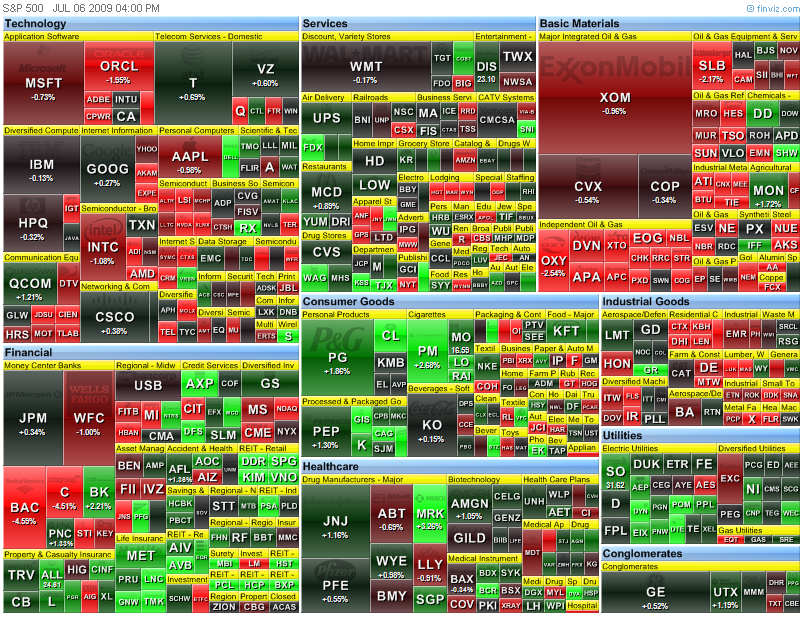
 Today's heatmap:
 Before market opens in BOLD
 What happens when they pay these bonuses (If they are allowed to)and the stock goes to it's proper place - zero - and needs another bailout? That should be some quality TV.
 Today's heatmap:
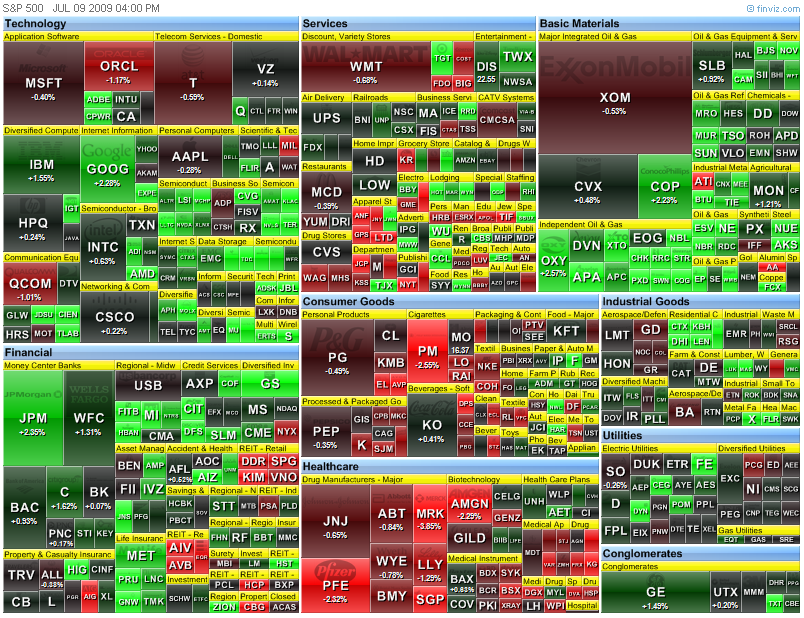
 Today after close:

 Before market opens in BOLD
 Before market opens in BOLD
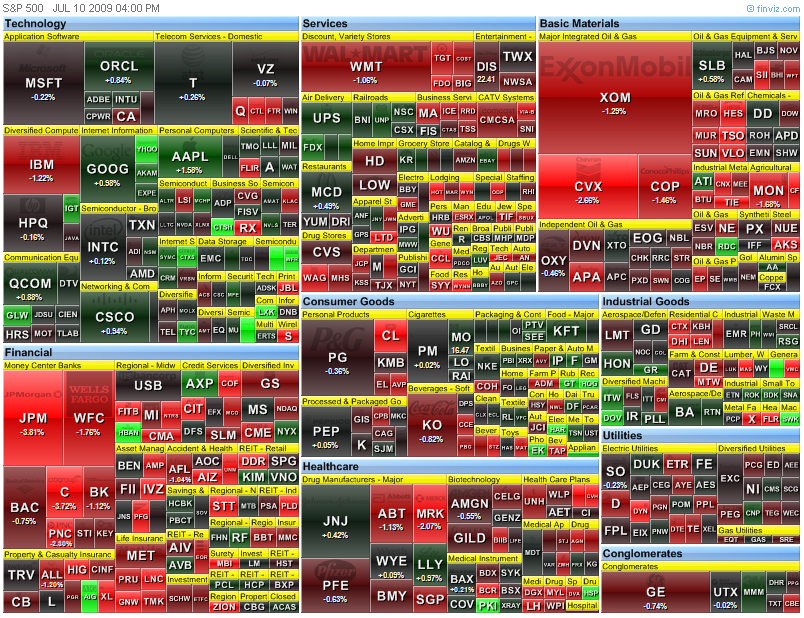
 Today's heatmap: