Friday, September 25, 2009

Market wrap - 5:00pm

Happy Friday. One bank closed today that we know of. Didn't catch the name. Dow 9,665 -42 -0.44% Nasdaq 2,091 -17 -0.79% S&P 500 1,044 -6 -0.61% Gold 992 -7 -0.73% Oil 66.06 0.13 0.20% Today by sector: Today's heatmap:

New home sales - 10:00am

Full report here NEW RESIDENTIAL SALES IN AUGUST 2009 Sales of new one-family houses in August 2009 were at a seasonally adjusted annual rate of 429,000, according to estimates released jointly today by the U.S. Census Bureau and the Department of Housing and Urban Development. This is 0.7 percent (±16.2%)* above the revised July rate of 426,000, but is 3.4 percent (±13.3%) below the August 2008 estimate of 444,000. The median sales price of new houses sold in August 2009 was $195,200; the average sales price was $256,800. The seasonally adjusted estimate of new houses for sale at the end of August was 262,000. This represents a supply of 7.3 months at the current sales rate.

Durable goods - 8:30am

Full report here New Orders New orders for manufactured durable goods in August decreased $4.0 billion or 2.4 percent to $164.4 billion, the U.S. Census Bureau announced today. This was the second decrease in the last three months. This followed a 4.8 percent July increase. Excluding transportation, new orders were down slightly. Excluding defense, new orders decreased 2.4 percent. Shipments Shipments of manufactured durable goods in August, down following two consecutive monthly increases, decreased $2.4 billion or 1.4 percent to $171.3 billion. This followed a 2.2 percent July increase. Unfilled Orders Unfilled orders for manufactured durable goods in August, down eleven consecutive months, decreased $2.8 billion or 0.4 percent to $737.1 billion. This was the longest streak of consecutive monthly decreases since the series was first published on a NAICS basis in 1992 and followed a 0.1 percent July decrease. Inventories Inventories of manufactured durable goods in August, down eight consecutive months, decreased $4.2 billion or 1.3 percent to $308.9 billion. This followed a 1.1 percent July decrease. Capital Goods Industries Nondefense Nondefense new orders for capital goods in August decreased $4.0 billion or 7.1 percent to $52.7 billion. Defense Defense new orders for capital goods in August increased $0.1 billion or 1.1 percent to $9.9 billion. Released September 25, 2009. This report presents advance information on two key business indicators: durable goods manufacturers' shipments and orders. Revised and more detailed estimates plus nondurable goods will be published October 2, 2009. The advance report on durable goods for September is scheduled for release October 28, 2009. More at link with formatted tables

Pre-market - Friday, September 25, 2009

Futures up slightly as of 7:30 DJIA INDEX 9,654.00 19.00 S&P 500 1,046.70 2.40 NASDAQ 100 1,700.25 0.75 Today's economic calendar: Durable Goods Orders 8:30 AM ET Consumer Sentiment 9:55 AM ET New Home Sales 10:00 AM ET Today's earnings reports: Before open: AZZ AZZ incorporated Industrial Goods Industrial Electrical Equipment KBH KB Home Industrial Goods Residential Construction PKE Park Electrochemical Corp. Technology Printed Circuit Boards SUTR Sutor Technology Group, Ltd. Basic Materials Steel & Iron After close: PSEM Pericom Semiconductor Corp. Technology Semiconductor - Integrated Circuits QBAK Qualstar Corp. Technology Diversified Electronics

Thursday, September 24, 2009

Market wrap - 4:50

Humm...what do we have going on here. Dow 9,707 -41 -0.42% Nasdaq 2,108 -24 -1.12% S&P 500 1,051 -10 -0.95% Gold 999 -16 -1.53% Oil 66.10 -3.08 -4.45% Today by sector: Today's heatmap: Of note: RIMM missed earnings, down 10 percent after hours. MCD upping dividend 10 percent.

Santelli explains chart patterns - 2:20pm

Good explanation on how chart patterns "can" signal a reversal in the market:

More fun video from CNBC and Santelli - 11:45

About 7 minutes or so in, the fun begins

Existing home sales - 10:15am

Full report here Existing-Home Sales Ease Following Four Monthly Gains Washington, September 24, 2009 Existing-home sales in August gave back some of their strong gain in July but remain above year-ago levels, according to the National Association of Realtors®. Existing-home sales – including single-family, townhomes, condominiums and co-ops – declined 2.7 percent to a seasonally adjusted annual rate1 of 5.10 million units in August from a pace of 5.24 million in July, but remain 3.4 percent above the 4.93 million-unit level in August 2008. In the previous four months, sales had risen a total of 15.2 percent. Lawrence Yun, NAR chief economist, said the tax credit is working. “Home sales retrenched from a very strong improvement in July but continue to be much higher than before the stimulus. The first-time buyer tax credit is having the intended impact of bringing buyers into the market, allowing them to take advantage of very favorable affordability conditions,” he said. “Some of the give-back in closed sales appears to result from rising numbers of contracts entering the system, with some fallouts and a backlog contributing to a longer closing process, but the decline demonstrates we can’t take a housing rebound for granted.” According to Freddie Mac, the national average commitment rate for a 30-year, conventional, fixed-rate mortgage fell to 5.19 percent in August from 5.22 percent in July; the rate was 6.48 percent in August 2008. An NAR practitioner survey shows first-time buyers purchased 30 percent of homes in August, and that distressed homes accounted for 31 percent of transactions; both were unchanged from July. “The recent trend shows broad improvement in most of the country, but with an expected rise in foreclosures over the next 12 months we need to maintain a healthy level of ready buyers to absorb the inventory. An extension of the tax credit is critical to preserve incentives for financially qualified buyers to enter the market,” Yun said. He added that many buyers had been on the sidelines during the past few years, waiting for signs of stabilization. “Now that the market is showing some momentum, we have an opportunity to achieve a more rapid and broader stabilization in home prices. Extending and expanding the tax credit also would help to keep other families from becoming upside down in their mortgages or risk foreclosure,” Yun said. “When home prices show sustained gains, credit will become more widely available to other sectors because Wall Street will be able to price risks confidently. Stable home values will also allow more families to purchase consumer products and provide a strong boost for the broader economy.” NAR President Charles McMillan, a broker with Coldwell Banker Residential Brokerage in Dallas-Fort Worth, said time is running very short for the existing tax credit. “Because it’s generally taking 60 days to close on a home after a contract is offered, buyers have little time to act to complete a purchase by the November 30 deadline,” he said. “There’s no guarantee what Congress might do, so there’s really no time to waste. Since Realtors® have unparalleled knowledge of local markets, they can also advise first-time buyers on any additional state or local programs that might be able to offer them financial assistance, and help them close on a home before the tax credit expires.” Total housing inventory at the end of August fell 10.8 percent to 3.62 million existing homes available for sale, which represents an 8.5-month supply2 at the current sales pace, down from a 9.3-month supply in July. Unsold inventory totals are 16.4 percent lower than a year ago. The national median existing-home price3 for all housing types was $177,700 in August, down 12.5 percent from August 2008. Distressed properties continue to downwardly distort the median price because they generally sell for 15 to 20 percent less than traditional homes. Single-family home sales fell 2.8 percent to a seasonally adjusted annual rate of 4.48 million in August from a level of 4.61 million in July, but are 2.5 percent higher than the 4.37 million-unit pace in August 2008. The median existing single-family home price was $177,500 in August, down 12.1 percent from a year ago. Existing condominium and co-op sales slipped 1.6 percent to a seasonally adjusted annual rate of 620,000 units in August from a spike of 630,000 in July, but are 10.1 percent higher than the 563,000-unit level a year ago. The median existing condo price4 was $179,300 in August, which is 15.7 percent below August 2008. Regionally, existing-home sales in the Northeast declined 2.2 percent to an annual pace of 910,000 in August, but are 5.8 percent above August 2008. The median price in the Northeast was $241,100, which is 10.5 percent below a year ago. Existing-home sales in the Midwest fell 6.6 percent in August to a level of 1.14 million but are unchanged from a year ago. The median price in the Midwest was $149,900, down 10.4 percent from August 2008. In the South, existing-home sales were down 3.1 percent to an annual pace of 1.89 million in August but are 1.6 percent above August 2008. The median price in the South was $157,400, which is 11.0 percent below a year ago. Existing-home sales in the West declined 2.7 percent to an annual rate of 1.16 million in August but are 7.4 percent higher than a year ago. The median price in the West was $220,500, down 12.2 percent from August 2008. The National Association of Realtors®, “The Voice for Real Estate,” is America’s largest trade association, representing 1.2 million members involved in all aspects of the residential and commercial real estate industries.

Jobless claims - 8:45am

Full report here UNEMPLOYMENT INSURANCE WEEKLY CLAIMS REPORT SEASONALLY ADJUSTED DATA In the week ending Sept. 19, the advance figure for seasonally adjusted initial claims was 530,000, a decrease of 21,000 from the previous week's revised figure of 551,000. The 4-week moving average was 553,500, a decrease of 11,000 from the previous week's revised average of 564,500. The advance seasonally adjusted insured unemployment rate was 4.6 percent for the week ending Sept. 12, a decrease of 0.1 percentage point from the prior week's unrevised rate of 4.7 percent. The advance number for seasonally adjusted insured unemployment during the week ending Sept. 12 was 6,138,000, a decrease of 123,000 from the preceding week's revised level of 6,261,000. The 4-week moving average was 6,187,250, a decrease of 1,250 from the preceding week's revised average of 6,188,500. The fiscal year-to-date average for seasonally adjusted insured unemployment for all programs is 5.651 million. UNADJUSTED DATA The advance number of actual initial claims under state programs, unadjusted, totaled 434,358 in the week ending Sept. 19, an increase of 21,966 from the previous week. There were 398,070 initial claims in the comparable week in 2008. The advance unadjusted insured unemployment rate was 3.9 percent during the week ending Sept. 12, a decrease of 0.1 percentage point from the prior week. The advance unadjusted number for persons claiming UI benefits in state programs totaled 5,204,972, a decrease of 91,789 from the preceding week. A year earlier, the rate was 2.3 percent and the volume was 3,014,874. Extended benefits were available in Alabama, Alaska, Arizona, Arkansas, California, Colorado, Connecticut, Delaware, the District of Columbia, Florida, Georgia, Idaho, Illinois, Indiana, Kansas, Kentucky, Maine, Massachusetts, Michigan, Minnesota, Missouri, Nevada, New Hampshire, New Jersey, New York, North Carolina, Ohio, Oregon, Pennsylvania, Puerto Rico, Rhode Island, South Carolina, Tennessee, Texas, Vermont, Virginia, Washington, West Virginia, and Wisconsin during the week ending Sept. 5. Initial claims for UI benefits by former Federal civilian employees totaled 1,141 in the week ending Sept. 12, a decrease of 401 from the prior week. There were 1,919 initial claims by newly discharged veterans, a decrease of 281 from the preceding week. There were 19,192 former Federal civilian employees claiming UI benefits for the week ending Sept. 5, a decrease of 1,233 from the previous week. Newly discharged veterans claiming benefits totaled 30,213, a decrease of 51 from the prior week. States reported 3,223,849 persons claiming EUC (Emergency Unemployment Compensation) benefits for the week ending Sept. 5, an increase of 82,364 from the prior week. There were 1,116,863 claimants in the comparable week in 2008. EUC weekly claims include both first and second tier activity. The highest insured unemployment rates in the week ending Sept. 5 were in Puerto Rico (6.7 percent), Oregon (5.6), Nevada (5.4), Pennsylvania (5.4), Michigan (5.2), Wisconsin (4.9), California (4.8), New Jersey (4.8), Connecticut (4.7), North Carolina (4.7), and South Carolina (4.7). The largest increases in initial claims for the week ending Sept. 12 were in Wisconsin (+1,573), Oregon (+829), and Kansas(+677), while the largest decreases were in Texas (-4,623), Illinois (-4,217), Pennsylvania (-3,961), Michigan (-3,012), and Massachusetts (-2,389).
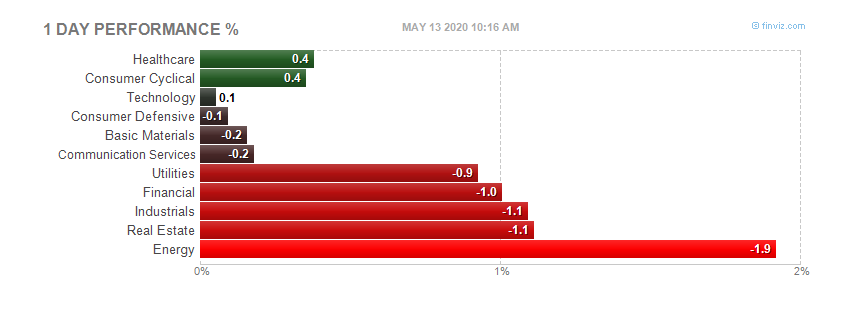
Pre-market - Thursday, September 24, 2009

Futures flat waiting on Jobless Claims at 8:30 DJIA INDEX 9,718.00 1.00 S&P 500 1,059.40 0.50 NASDAQ 100 1,729.75 4.25 Today's earnings calendar: Jobless Claims 8:30 AM ET Existing Home Sales 10:00 AM ET EIA Natural Gas Report 10:30 AM ET 3-Month Bill Announcement 11:00 AM ET 6-Month Bill Announcement 11:00 AM ET Christina Romer Speaks 1:00 PM ET 7-Yr Note Auction 1:00 PM ET Money Supply 4:30 PM ET Today's earnings reports: Before open: AM American Greetings Corp. Services Business Services COMS 3Com Corporation Technology Networking & Communication Devices CRAI CRA International Inc. Services Management Services MKC McCormick & Co. Inc. Consumer Goods Processed & Packaged Goods MTN Vail Resorts Inc. Services Resorts & Casinos NEOG Neogen Corp. Healthcare Diagnostic Substances OHB Orleans Homebuilders Inc. Industrial Goods Residential Construction RAD Rite Aid Corp. Services Drug Stores SCHL Scholastic Corporation Services Publishing - Books SCS Steelcase Inc. Consumer Goods Business Equipment TXI Texas Industries Inc. Industrial Goods Cement ZLC Zale Corporation Services Jewelry Stores After close: ADAT Authentidate Holding Corp. Technology ALOG Analogic Corporation Technology CBK Christopher & Banks Corp. Services FINL Finish Line Inc. Services LPTH LightPath Technologies Inc. Technology PSDV pSivida Corp. Healthcare PSEM Pericom Semiconductor Corp. Technology RIMM Research In Motion Ltd. Technology SABA Saba Software Inc. Technology SPEC Spectrum Control Inc. Technology TIBX Tibco Software Inc. Technology TSCM TheStreet.com, Inc. Technology UAHC United American Healthcare Corp. Financial

Wednesday, September 23, 2009

Mark Haines asking tough questions to Wellpoint - 10:30pm

Missed this today, but interesting just the same

Market wrap - 4:15

Dow 9,749 -81 -0.83% Nasdaq 2,131 -15 -0.69% S&P 5001,061 -11 -1.01% Gold 1,014 -1 -0.11% Oil 68.35 -2.79 -3.92% By Sector: Today's heatmap

FED Statement - 2:15pm

Full report here Release Date: September 23, 2009 For immediate release Information received since the Federal Open Market Committee met in August suggests that economic activity has picked up following its severe downturn. Conditions in financial markets have improved further, and activity in the housing sector has increased. Household spending seems to be stabilizing, but remains constrained by ongoing job losses, sluggish income growth, lower housing wealth, and tight credit. Businesses are still cutting back on fixed investment and staffing, though at a slower pace; they continue to make progress in bringing inventory stocks into better alignment with sales. Although economic activity is likely to remain weak for a time, the Committee anticipates that policy actions to stabilize financial markets and institutions, fiscal and monetary stimulus, and market forces will support a strengthening of economic growth and a gradual return to higher levels of resource utilization in a context of price stability. With substantial resource slack likely to continue to dampen cost pressures and with longer-term inflation expectations stable, the Committee expects that inflation will remain subdued for some time. In these circumstances, the Federal Reserve will continue to employ a wide range of tools to promote economic recovery and to preserve price stability. The Committee will maintain the target range for the federal funds rate at 0 to 1/4 percent and continues to anticipate that economic conditions are likely to warrant exceptionally low levels of the federal funds rate for an extended period. To provide support to mortgage lending and housing markets and to improve overall conditions in private credit markets, the Federal Reserve will purchase a total of $1.25 trillion of agency mortgage-backed securities and up to $200 billion of agency debt. The Committee will gradually slow the pace of these purchases in order to promote a smooth transition in markets and anticipates that they will be executed by the end of the first quarter of 2010. As previously announced, the Federal Reserve’s purchases of $300 billion of Treasury securities will be completed by the end of October 2009. The Committee will continue to evaluate the timing and overall amounts of its purchases of securities in light of the evolving economic outlook and conditions in financial markets. The Federal Reserve is monitoring the size and composition of its balance sheet and will make adjustments to its credit and liquidity programs as warranted. Voting for the FOMC monetary policy action were: Ben S. Bernanke, Chairman; William C. Dudley, Vice Chairman; Elizabeth A. Duke; Charles L. Evans; Donald L. Kohn; Jeffrey M. Lacker; Dennis P. Lockhart; Daniel K. Tarullo; Kevin M. Warsh; and Janet L. Yellen.

Crude oil - green shoots? 12:00

Crude extends losses after EIA petroleum data NEW YORK (MarketWatch) -- Crude-oil futures extended losses Wednesday after the Energy Information Administration reported increases in U.S. petroleum inventories last week as gasoline demand dropped to the lowest level in nearly eight months. Crude inventories rose 2.8 million barrels in the week ended Sept 18, gasoline inventories gained 5.4 million barrels, and distillate stockpiles, which include diesel and heating oil, rose 3 million barrels. Gasoline supplied, an implied gauge of consumption, fell to 8.79 million barrels a day, the lowest level since late January, the EIA data showed. On the New York Mercantile Exchange, November crude lost $2.72, or 3.8%, to $69.04 a barrel. It was down less than 2% ahead of the data.

Pre-market - Wednesday, September 23, 2009

Futures up slightly this morning: DJIA INDEX 9,786.00 15.00 S&P 500 1,069.40 2.10 NASDAQ 100 1,738.75 4.50 Today's economic reports: MBA Purchase Applications 7:00 AM ET EIA Petroleum Status Report 10:30 AM ET 5-Yr Note Auction 1:00 PM ET FOMC Meeting Announcement 2:15 PM ET Today's earnings reports: Before open: AZO AutoZone Inc. Services Auto Parts Stores GIS General Mills Inc. Consumer Goods Processed & Packaged Goods After close: BBBY Bed Bath & Beyond, Inc. Services Home Furnishing Stores CMTL Comtech Telecommunications Corp. Technology Communication Equipment CPRT Copart Inc. Services Auto Dealerships CTAS Cintas Corp. Services Business Services OHB Orleans Homebuilders Inc. Industrial Goods Residential Construction PAYX Paychex Inc. Services Staffing & Outsourcing Services RHT Red Hat Inc. Technology Application Software

Market wrap for Tuesday, September 22, 2009

Dow /quotes/comstock/10w!i:dji/delayed 9,830 51 0.52% Nasdaq/quotes/comstock/10y!i:comp 2,146 8 0.39% S&P 500/quotes/comstock/21z!i1:in\x 1,072 7 0.66% Today by sector: Today's heatmap:

Tuesday, September 22, 2009

Pre-market - Tuesday, September 22, 2009

Futures up this morning DJIA INDEX 9,783.00 65.00 S&P 500 1,067.90 7.50 NASDAQ 100 1,738.75 11.00 Today's economic calendar: ICSC-Goldman Store Sales 7:45 AM ET Redbook 8:55 AM ET 4-Week Bill Auction 11:30 AM ET 52-Week Bill Auction 11:30 AM ET 2-Yr Note Auction 1:00 PM ET Today's earnings reports: Before open: CAG ConAgra Foods, Inc. Consumer Goods Processed & Packaged Goods CCL Carnival Corp. Services General Entertainment FDS FactSet Research Systems Inc. Technology Information & Delivery Services GIGM GigaMedia Ltd. Technology Internet Software & Services KMX CarMax Inc. Services Auto Dealerships PRGS Progress Software Corp. Technology Application Software RAIL FreightCar America Inc. Services Railroads VSR Versar Inc. Services Technical Services Today after close: AIR AAR Corp. Industrial Goods Aerospace/Defense Products & Services FIF Financial Federal Corp. Financial Credit Services FUL HB Fuller Co. Basic Materials Specialty Chemicals

Market wrap - a day late - Tuesday, September 22, 2009

The results from yesterday: Dow 9,779 -41 -0.42% Nasdaq 2,138 5 0.24% S&P 500 1,065 -4 -0.34% Gold 1,005 -5 -0.53% Oil 70.75 +1.04 +1.49% Today by sector: Today's heatmap:

Monday, September 21, 2009

Leading Indicators - 10:00am

Full report here Released: Monday, September 21, 2009 The Conference Board Leading Economic Index™ (LEI) for the U.S. increased 0.6 percent in August, following a 0.9 percent gain in July, and a 0.8 percent rise in June. Download a PDF of the technical notes for underlying detail, diffusion indexes, components, contributions and graphs. Download a PDF of the press release with graph and summary table. "Since reaching a peak in July 2007, the LEI fell for twenty months – the longest downtrend since the mid 1970s – but it has been rising since April and its gains have become very widespread," says Ataman Ozyildirim, Economist at The Conference Board. "The six-month growth rate of the LEI continues to accelerate. At the same time, the downtrend in the coincident economic index, measuring current economic activity, seems to be stabilizing, with the index flat so far this quarter." Says Ken Goldstein, Economist at The Conference Board: "The LEI has risen for five consecutive months and the coincident economic index has stopped falling. Taken together, this suggests that the recession is bottoming out. These numbers are consistent with the view that after a very severe downturn, a recovery is very near. But, the intensity and pattern of that recovery is more uncertain." The Conference Board Coincident Economic Index™ (CEI) for the U.S. was unchanged in August, following a 0.1 percent increase in July, and a 0.4 percent decline in June. The Conference Board Lagging Economic Index™ (LAG) declined 0.1 percent in August, following a 0.5 percent decline in July, and a 0.9 percent decline in June. The next release is scheduled for Thursday, October 22, 2009 at 10 A.M. ET. Professional Contacts at The Conference Board: Ken Goldstein: 212-339-0331 Indicators Program: 212-339-0330 Media Contacts: Frank Tortorici: +1 212 339 0231 Email: indicators@conference-board.org

Pre-market - Monday, Septmember 21,2009

Futures pointing to the downside this morning: DJIA INDEX 9,696.00 -37.00 S&P 500 1,055.80 -5.20 NASDAQ 100 1,713.25 -8.00 Today's economic calendar: Leading Indicators 10:00 AM ET 4-Week Bill Announcement 11:00 AM ET 3-Month Bill Auction 1:00 PM ET 6-Month Bill Auction 1:00 PM ET Today's earnings reports: Before open = LEN Business Services After close = SNX Business Services