Friday, October 9, 2009
International Trade - 8:30 am
Full report here
U.S. INTERNATIONAL TRADE IN GOODS AND SERVICES
August 2009
Goods and Services
The U.S. Census Bureau and the U.S. Bureau of Economic Analysis, through the Department of Commerce, announced today that total August exports of $128.2 billion and imports of $158.9 billion resulted in a goods and services deficit of $30.7 billion, down from $31.9 billion in July, revised. August exports were $0.2 billion more than July exports of $128.0 billion. August imports were $0.9 billion less than July imports of $159.8 billion.
In August, the goods deficit decreased $0.8 billion from July to $41.9 billion, and the services surplus increased $0.3 billion to $11.2 billion. Exports of goods were virtually unchanged at $86.8 billion, and imports of goods decreased $0.8 billion to $128.7 billion. Exports of services increased $0.2 billion to $41.4 billion, and imports of services decreased $0.1 billion to $30.2 billion.
In August, the goods and services deficit decreased $30.2 billion from August 2008. Exports were down $33.4 billion, or 20.7 percent, and imports were down $63.6 billion, or 28.6 percent.
Goods (Census basis)
The July to August decrease in exports of goods reflected decreases in capital goods ($1.3 billion), other goods ($0.4 billion), and consumer goods ($0.1 billion). Increases occurred in industrial supplies and materials ($0.9 billion); automotive vehicles, parts, and engines ($0.5 billion); and foods, feeds, and beverages ($0.1 billion).
The July to August decrease in imports of goods reflected decreases in industrial supplies and materials ($1.0 billion); consumer goods ($0.7 billion); other goods ($0.2 billion); foods, feeds, and beverages ($0.1 billion); and capital goods ($0.1 billion). An increase occurred in automotive vehicles, parts, and engines ($1.2 billion).
The August 2008 to August 2009 decrease in exports of goods reflected decreases in industrial supplies and materials ($11.3 billion); capital goods ($9.5 billion); automotive vehicles, parts, and engines ($3.0 billion); foods, feeds, and beverages ($2.0 billion); consumer goods ($1.6 billion); and other goods ($1.0 billion).
The August 2008 to August 2009 decrease in imports of goods reflected decreases in industrial supplies and materials ($36.1 billion); capital goods ($8.0 billion); consumer goods ($7.2 billion); automotive vehicles, parts, and engines ($4.7 billion); foods, feeds, and beverages ($1.1 billion); and other goods ($0.7 billion).
Services
Services exports increased $0.2 billion from July to August. The increase was more than accounted for by increases in travel, other transportation (which includes freight and port services), and other private services (which includes items such as business, professional, and technical services, insurance services, and financial services). A decrease in transfers under U.S. military sales contracts was partly offsetting. Changes in other categories of services exports were small.
Services imports decreased $0.1 billion from July to August. The decrease was more than accounted for by a decrease in other transportation. An increase in travel was partly offsetting. Changes in other categories of services imports were small.
The August 2008 to August 2009 decrease in exports of services was $5.6 billion. The largest decreases were in travel ($2.0 billion), other transportation ($1.5 billion), and royalties and license fees ($0.9 billion).
The August 2008 to August 2009 decrease in imports of services was $5.5 billion. The largest decreases were in other transportation ($2.2 billion), royalties and license fees ($1.2 billion), and passenger fares ($0.7 billion).
Goods and Services Moving Average
For the three months ending in August, exports of goods and services averaged $127.0 billion, while imports of goods and services averaged $157.1 billion, resulting in an average trade deficit of $30.0 billion. For the three months ending in July, the average trade deficit was $28.6 billion, reflecting average exports of $125.1 billion and average imports of $153.6 billion.
Selected Not Seasonally Adjusted Goods Details
The August figures show surpluses, in billions of dollars, with Hong Kong $1.3 ($1.3 for July), Australia $1.2 ($0.7), Egypt $0.4 ($0.2), and Singapore $0.3 ($0.7). Deficits were recorded, in billions of dollars, with China $20.2 ($20.4), OPEC $6.4 ($6.9), European Union $5.4 ($8.0), Japan $4.3 ($3.9), Mexico $4.0 ($2.9), Venezuela $1.9 ($2.3), Nigeria $1.7 ($1.7), Canada $1.5 ($2.1), Taiwan $0.5 ($0.7), and Korea $0.4 ($1.0).
Advanced technology products exports were $18.5 billion in August and imports were $24.1 billion, resulting in a deficit of $5.6 billion. August exports were $1.5 billion less than the $20.0 billion in July, while August imports were $2.4 billion less than the $26.6 billion in July.
Revisions
Goods exports and imports for July were each revised up $0.1 billion. For July, revised export carry-over was virtually zero, revised down from $0.1 billion (0.1 percent). For July, revised import carry-over was $0.1 billion (0.1 percent), revised down from $0.6 billion (0.4 percent). Goods carry-over in August was virtually zero for exports and $0.7 billion (0.5 percent) for imports.
Services exports for July were revised up $0.3 billion to $41.2 billion. The revision was mostly accounted for by upward revisions in travel, other private services, and passenger fares. Services imports for July were revised up $0.2 billion to $30.3 billion. The revision was mostly accounted for by upward revisions in travel and passenger fares.
More at link with formatted tables
Pre-market - Friday, October 9, 2009
Futures about even at 7:30 am.
DJIA INDEX 9,743.00 -4.00
S&P 500 1,063.30 -0.50
NASDAQ 100 1,712.00 -4.50
Today's economic calendar:
International Trade 8:30 AM ET
Today's earnings reports:
Before open:
CMN Cantel Medical Corp. Healthcare Medical Instruments & Supplies
After close = NONE
Thursday, October 8, 2009

The dollar - good article from the WSJ
Full article here
By DAVID MALPASS
If you want to know why the dollar has been falling this week and gold hit a new high, look no further than the weak jobs numbers last Friday and the weak communique issued over the weekend at the G-7 meeting in Istanbul. Deploring "excess volatility and disorderly movements in exchange rates" isn't exactly a ringing defense of the greenback. And 9.8% unemployment convinced markets that monetary policy will remain loose regardless of dollar weakness.
Bond buyer Bill Gross of the Pimco fund summed up the situation nicely in a recent CNBC interview. Asked whether low interest rates will weaken the dollar, the influential allocator of global capital said: "I think that's part of the administration's plan. It's obviously not announced—the 'strong dollar' is always the policy, so to speak. One of the ways a country gets out from under its debt burden is to devalue."
On the surface, the weak dollar may not look so bad, especially for Wall Street. Gold, oil, the euro and equities are all rising as much as the dollar declines. They stay even in value terms and create lots of trading volume. And high unemployment keeps the Fed on hold, so anyone with extra dollars or the connections to borrow dollars wins by buying nondollar assets.
 Investors have been playing this weak-dollar trade for years, diverting more and more dollars into commodities, foreign currencies and foreign stock markets. This is the Third-World way of asset allocation.
Corporations play this game for bigger stakes, borrowing billions in dollars to expand their foreign businesses. As the pound slid in the 1950s and '60s and the British Empire crumbled, the corporations that prospered were the ones that borrowed pounds aggressively in order to expand abroad. Though British equities rose in pound terms, they generally underperformed gold and foreign equities. At the end of empire, the giant sucking sound was from British capital and jobs moving offshore as the pound sank.
Some weak-dollar advocates believe that American workers will eventually get cheap enough in foreign-currency terms to win manufacturing jobs back. In practice, however, capital outflows overwhelm the trade flows, causing more job losses than cheap real wages create. This was the lesson of the British malaise, the Carter malaise, the Mexican malaise of the 1990s, Yeltsin's Russian malaise through 1999 and the rest. No countries have devalued their way into prosperity, while many—Hong Kong, China, Australia today—have used stable money to invite capital and jobs.
The more the dollar devalued against the yen in the 1970s and '80s, the more Japan gained share in valued-added manufacturing, using the capital from weak-currency countries to increase productivity. China is doing the same now. It watches in chagrin as the U.S. pleads with it to strengthen the yuan, adding productivity fast with the dollars rushing its way in search of currency stability.
If stocks double but the dollar loses half its value, who beyond Wall Street are the winners and losers? There's been a clear demonstration this decade. The S&P nearly doubled from 2003 through 2007. Those who borrowed to buy won big-time. Rich people got richer, seeing their equity bottom line double. At the same time, the dollar's value was cut nearly in half versus the euro and other stable measures. Capital fled, undercutting job growth. Rent, gasoline and food prices rose more than wages.
Equity gains provide cold comfort when currencies crash. From the euro perspective, the S&P peaked at 1700 in 2000, finally reattained 1100 in the 2007 bubble, fell below 600 in March and now stands at 700 (see nearby chart). With most of the market capitalization of U.S. stocks held by Americans, the dollar devaluation has caused a massive decline in the U.S. share of global wealth.
Measured in euros (a more stable ruler than the ever-weakening dollar), U.S. real per capita GDP is down 25% since 2000, while Germany's is up 4% and tops ours.
The solution is a strong U.S. jobs and wealth program. It has to include stable money, a flatter, more competitive tax structure, spending restraint, and common-sense bank regulation so small business lending can restart. Treasury has to rapidly lengthen the maturity of the national debt and take steps to protect the Fed from market losses on its long-term debt holdings.
Instead, Washington's current economic program pushes capital away by weakening the dollar, threatening higher tax rates, borrowing short (the Fed's near trillion-dollar overnight debt, Treasury's mounds of bill and note issuance) to lend long (mortgages, student loans, entitlements), doubling down on government subsidies, and rechanneling bank loans to governments and big businesses instead of the small business job-growth engine.
It's possible global bond vigilantes will call Washington's bluff, reducing their bond purchases until we stop devaluing and restart job growth, which is the ultimate source of tax revenues to repay our bond debt. This would create a Volcker moment when the U.S. might tighten even as the economy slowed (as then Fed Chairman Paul Volcker did back in 1979).
But the accepted outlook is the almost-as-gloomy new norm. If all goes according to current plans, the dollar devalues slowly and bond buyers come back for more even as national debt heads toward $15 trillion. World living standards grow faster than ours, as does global wealth. The Fed chases inflation as the dollar sinks, but not so fast as to stop the recovery. More capital moves abroad, leaving U.S. unemployment too high too long.
A better approach would start with President Barack Obama rejecting the Bush administration's weak-dollar policy. This would invite capital and jobs to come back before interest rates have to rise.
Mr. Malpass is president of Encima Global LLC.
Investors have been playing this weak-dollar trade for years, diverting more and more dollars into commodities, foreign currencies and foreign stock markets. This is the Third-World way of asset allocation.
Corporations play this game for bigger stakes, borrowing billions in dollars to expand their foreign businesses. As the pound slid in the 1950s and '60s and the British Empire crumbled, the corporations that prospered were the ones that borrowed pounds aggressively in order to expand abroad. Though British equities rose in pound terms, they generally underperformed gold and foreign equities. At the end of empire, the giant sucking sound was from British capital and jobs moving offshore as the pound sank.
Some weak-dollar advocates believe that American workers will eventually get cheap enough in foreign-currency terms to win manufacturing jobs back. In practice, however, capital outflows overwhelm the trade flows, causing more job losses than cheap real wages create. This was the lesson of the British malaise, the Carter malaise, the Mexican malaise of the 1990s, Yeltsin's Russian malaise through 1999 and the rest. No countries have devalued their way into prosperity, while many—Hong Kong, China, Australia today—have used stable money to invite capital and jobs.
The more the dollar devalued against the yen in the 1970s and '80s, the more Japan gained share in valued-added manufacturing, using the capital from weak-currency countries to increase productivity. China is doing the same now. It watches in chagrin as the U.S. pleads with it to strengthen the yuan, adding productivity fast with the dollars rushing its way in search of currency stability.
If stocks double but the dollar loses half its value, who beyond Wall Street are the winners and losers? There's been a clear demonstration this decade. The S&P nearly doubled from 2003 through 2007. Those who borrowed to buy won big-time. Rich people got richer, seeing their equity bottom line double. At the same time, the dollar's value was cut nearly in half versus the euro and other stable measures. Capital fled, undercutting job growth. Rent, gasoline and food prices rose more than wages.
Equity gains provide cold comfort when currencies crash. From the euro perspective, the S&P peaked at 1700 in 2000, finally reattained 1100 in the 2007 bubble, fell below 600 in March and now stands at 700 (see nearby chart). With most of the market capitalization of U.S. stocks held by Americans, the dollar devaluation has caused a massive decline in the U.S. share of global wealth.
Measured in euros (a more stable ruler than the ever-weakening dollar), U.S. real per capita GDP is down 25% since 2000, while Germany's is up 4% and tops ours.
The solution is a strong U.S. jobs and wealth program. It has to include stable money, a flatter, more competitive tax structure, spending restraint, and common-sense bank regulation so small business lending can restart. Treasury has to rapidly lengthen the maturity of the national debt and take steps to protect the Fed from market losses on its long-term debt holdings.
Instead, Washington's current economic program pushes capital away by weakening the dollar, threatening higher tax rates, borrowing short (the Fed's near trillion-dollar overnight debt, Treasury's mounds of bill and note issuance) to lend long (mortgages, student loans, entitlements), doubling down on government subsidies, and rechanneling bank loans to governments and big businesses instead of the small business job-growth engine.
It's possible global bond vigilantes will call Washington's bluff, reducing their bond purchases until we stop devaluing and restart job growth, which is the ultimate source of tax revenues to repay our bond debt. This would create a Volcker moment when the U.S. might tighten even as the economy slowed (as then Fed Chairman Paul Volcker did back in 1979).
But the accepted outlook is the almost-as-gloomy new norm. If all goes according to current plans, the dollar devalues slowly and bond buyers come back for more even as national debt heads toward $15 trillion. World living standards grow faster than ours, as does global wealth. The Fed chases inflation as the dollar sinks, but not so fast as to stop the recovery. More capital moves abroad, leaving U.S. unemployment too high too long.
A better approach would start with President Barack Obama rejecting the Bush administration's weak-dollar policy. This would invite capital and jobs to come back before interest rates have to rise.
Mr. Malpass is president of Encima Global LLC.
Jobless claims - 8:30
Full report here
UNEMPLOYMENT INSURANCE WEEKLY CLAIMS REPORT
SEASONALLY ADJUSTED DATA
In the week ending Oct. 3, the advance figure for seasonally adjusted initial claims was 521,000, a decrease of 33,000 from the previous week's revised figure of 554,000. The 4-week moving average was 539,750, a decrease of 9,000 from the previous week's revised average of 548,750.
The advance seasonally adjusted insured unemployment rate was 4.5 percent for the week ending Sept. 26, a decrease of 0.1 percentage point from the prior week's unrevised rate of 4.6 percent.
The advance number for seasonally adjusted insured unemployment during the week ending Sept. 26 was 6,040,000, a decrease of 72,000 from the preceding week's revised level of 6,112,000. The 4-week moving average was 6,144,250, a decrease of 15,750 from the preceding week's revised average of 6,160,000.
The fiscal year-to-date average for seasonally adjusted insured unemployment for all programs is 5.677 million.
UNADJUSTED DATA
The advance number of actual initial claims under state programs, unadjusted, totaled 449,375 in the week ending Oct. 3, an increase of 3,757 from the previous week. There were 426,789 initial claims in the comparable week in 2008.
The advance unadjusted insured unemployment rate was 3.8 percent during the week ending Sept. 26, unchanged from the prior week. The advance unadjusted number for persons claiming UI benefits in state programs totaled 4,994,971, a decrease of 77,884 from the preceding week. A year earlier, the rate was 2.3 percent and the volume was 3,057,698.
Extended benefits were available in Alabama, Alaska, Arizona, Arkansas, California, Colorado, Connecticut, Delaware, the District of Columbia, Florida, Georgia, Idaho, Illinois, Indiana, Kansas, Kentucky, Maine, Massachusetts, Michigan, Minnesota, Missouri, Nevada, New Hampshire, New Jersey, New Mexico, New York, North Carolina, Ohio, Oregon, Pennsylvania, Puerto Rico, Rhode Island, South Carolina, Tennessee, Texas, Vermont, Virginia, Washington, West Virginia, and Wisconsin during the week ending Sept. 19.
Initial claims for UI benefits by former Federal civilian employees totaled 1,499 in the week ending Sept. 26, an increase of 44 from the prior week. There were 2,387 initial claims by newly discharged veterans, an increase of 91 from the preceding week.
There were 19,523 former Federal civilian employees claiming UI benefits for the week ending Sept. 19, a decrease of 885 from the previous week. Newly discharged veterans claiming benefits totaled 30,550, a decrease of 139 from the prior week.
States reported 3,321,210 persons claiming EUC (Emergency Unemployment Compensation) benefits for the week ending Sept. 19, an increase of 45,997 from the prior week. There were 1,140,558 claimants in the comparable week in 2008. EUC weekly claims include both first and second tier activity.
The highest insured unemployment rates in the week ending Sept. 19 were in Puerto Rico (6.1 percent), Oregon (5.3), Nevada (5.2), Pennsylvania (5.0), California (4.9), Michigan (4.8), Wisconsin (4.7), Arkansas (4.6), North Carolina (4.6), and South Carolina (4.5).
The largest increases in initial claims for the week ending Sept. 26 were in California (+4,467), Ohio (+3,421), Illinois (+1,815), Missouri (+1,049), and Tennessee (+1,048), while the largest decreases were in New York (-2,253), North Carolina (-1,609), South Carolina (-1,159), Arkansas (-818), and Florida
(-734).
More at link with formatted tables
Pre-market - Thursday, October 8, 2009
Futures up big after Alcoa reported last night. More to come today.
DJIA INDEX 9,750.00 77.00
S&P 500 1,063.00 9.40
NASDAQ 100 1,720.75 12.75
Today's economic calendar:
BOE Announcement 7:00 AM ET
ECB Announcement 7:45 AM ET
Jobless Claims 8:30 AM ET
RBC CASH Index 9:00 AM ET
Wholesale Trade 10:00 AM ET
EIA Natural Gas Report 10:30 AM ET
3-Month Bill Announcement 11:00 AM ET
6-Month Bill Announcement 11:00 AM ET
30-Yr Bond Auction 1:00 PM ET
Today's earnings reports:
Before market opens:
ISCA International Speedway Corp. Services Sporting Activities
MAR Marriott International, Inc. Services Lodging
PEP Pepsico, Inc. Consumer Goods Processed & Packaged Goods
PGR Progressive Corp. Financial Property & Casualty Insurance
After close:
CAMP CalAmp Corp. Technology Communication Equipment
INFY Infosys Technologies Limited Technology Technical & System Software
NUHC Nu Horizons Electronics Corp. Services Electronics Wholesale
PCBK Pacific Continental Corp. Financial Regional - Pacific Banks
TSCM TheStreet.com, Inc. Technology Internet Information Providers
Wednesday, October 7, 2009
Pre-market - Wednesday, October 7,2009
Futures up slightly this morning
DJIA INDEX 9,664.00 10.00
S&P 500 1,049.50 0.90
NASDAQ 100 1,702.75 2.00
Today's economic calendar:
MBA Purchase Applications 7:00 AM ET
EIA Petroleum Status Report 10:30 AM ET
10-Yr Note Auction 1:00 PM ET
Consumer Credit 3:00 PM E
Today's earnings reports:
Before open:
AYI Acuity Brands, Inc. Consumer Goods Home Furnishings & Fixtures
COST Costco Wholesale Corporation Services Discount, Variety Stores
FDO Family Dollar Stores Inc. Services Discount, Variety Stores
HELE Helen of Troy Limited Consumer Goods Appliances
LNN Lindsay Corporation Industrial Goods Farm & Construction Machinery
MERX Merix Corp. Technology Printed Circuit Boards
MON Monsanto Co. Basic Materials Agricultural Chemicals
WWW Wolverine World Wide Inc. Consumer Goods Textile - Apparel Footwear & Accessories
After close:
AA Alcoa, Inc. Basic Materials Aluminum
KED Kayne Anderson Energy Development Company Financial Closed-End Fund - Equity
PRXI Premier Exhibitions Inc. Services General Entertainment
RELL Richardson Electronics Ltd. Services Electronics Wholesale
RT Ruby Tuesday, Inc. Services Restaurants
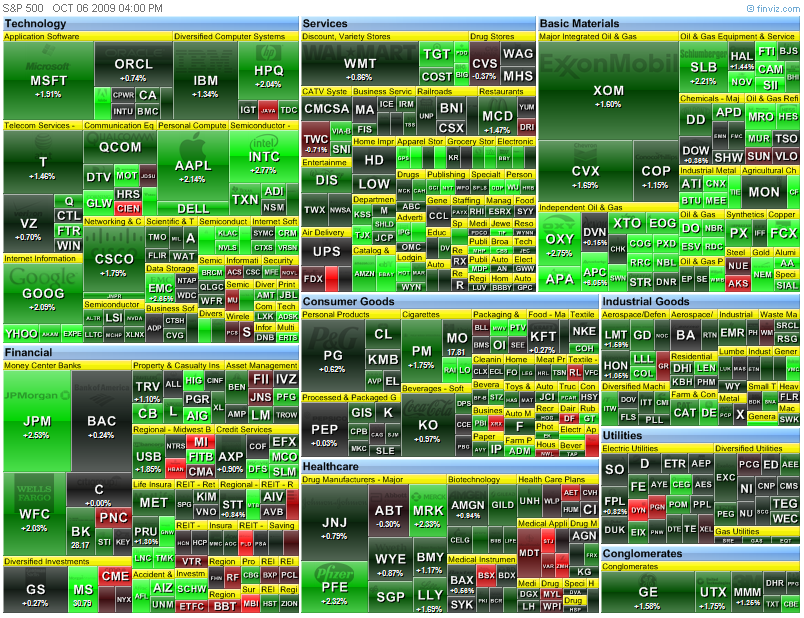
Tuesday, October 6, 2009
Market wrap - 4:30
Dow 9,731 132 1.37%
Nasdaq 2,104 35 1.71%
S&P 500 1,055 14 1.37%
Gold 1,040 +22 +2.15%
Oil 71.04 0.47 0.67%
Today by sector:
Today's heatmap:
 Today's heatmap:
Today's heatmap:
Pre-market - Tuesday, October 6, 2009
Futures up pretty big this morning
DJIA INDEX 9,620.00 74.00
S&P 500 1,046.70 10.30
NASDAQ 100 1,688.00 14.00
Today's economic calendar:
ICSC-Goldman Store Sales 7:45 AM ET
Redbook 8:55 AM ET
4-Week Bill Auction 11:30 AM ET
3-Yr Note Auction 1:00 PM ET
Treasury STRIPS 3:00 PM ET
Today's earnings reports:
Before market opens:
CHTT Chattem Inc. Consumer Goods Personal Products
GIGM GigaMedia Ltd. Technology Internet Software & Services
PBG Pepsi Bottling Group Inc. Consumer Goods Beverages - Soft Drinks
After market closes:
ANGO AngioDynamics Inc. Healthcare Medical Instruments & Supplies
YUM Yum! Brands, Inc. Services Restaurants
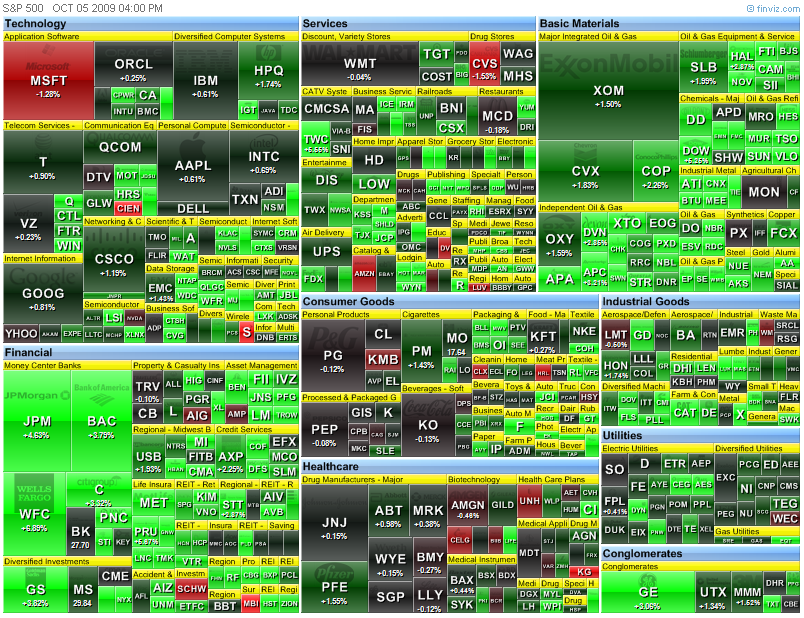
Monday, October 5, 2009
Market wrap - 6:00
Dow 9,600 112 1.18%
Nasdaq 2,068 20 0.98%
S&P 500 1,040 15 1.49%
Gold 1,018 +14 +1.34%
Oil 70.25 0.46 0.66%
Today by sector:

ISM non-mfg index report - 10:00
Full report here
September 2009 Non-Manufacturing ISM Report On Business®
NMI (Non-Manufacturing Index) at 50.9%
DO NOT CONFUSE THIS NATIONAL REPORT with the various regional purchasing reports released across the country. The national report's information reflects the entire United States, while the regional reports contain primarily regional data from their local vicinities. Also, the information in the regional reports is not used in calculating the results of the national report. The information compiled in this report is for the month of September 2009.
Business Activity Index at 55.1%
New Orders Index at 54.2%
Employment Index at 44.3%
More at link with formatted tables.
Pre-market - Monday, October 5,2009
Futures up this morning after a week won by the Bears:
DJIA INDEX 9,472.00 37.00
S&P 500 1,027.00 5.30
NASDAQ 100 1,672.00 9.75
Today's economic calendar:
ISM Non-Mfg Index 10:00 AM ET
4-Week Bill Announcement 11:00 AM ET
3-Month Bill Auction 11:30 AM ET
6-Month Bill Auction 11:30 AM ET
10-Yr TIPS Auction 1:00 PM ET
Today's earnings reports:
Before open:
RPM
After close:
MOS Mosaic Co. Basic Materials Agricultural Chemicals
PEDH Peoples Educational Holdings, Inc. Services Publishing - Books
RBN Robbins & Myers Inc. Industrial Goods Diversified Machinery
TISI Team Inc. Services Business Services
Subscribe to:
Posts (Atom)
